How to open IES and LDT files on a Mac
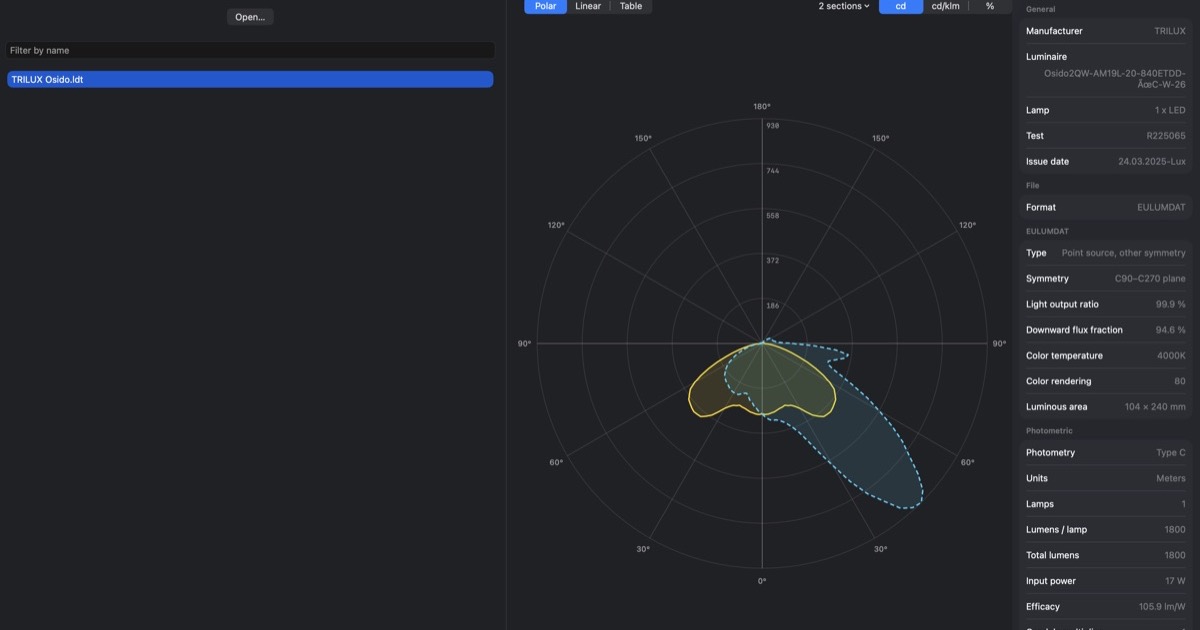
You downloaded a luminaire's photometric data and got a file ending in .ies or .ldt. Double-clicking it on a Mac either does nothing or opens a text editor full of numbers. This article explains what these files are and lists the realistic ways to look at them on macOS.
What IES and LDT files are
Both formats describe how a luminaire distributes light, as measured in a lab (a goniophotometer).
- IES is the IESNA LM-63 format, published by the Illuminating Engineering Society. It is the common format in North America and in 3D rendering. There are several revisions (1986, 1991, 1995, 2002 and 2019), and real-world files are often loosely formatted.
- EULUMDAT (
.ldt) is a European format with a similar purpose. It is widely used by European manufacturers and by lighting software there.
Lighting designers and architects use these files to simulate a luminaire in a room before it is installed. Manufacturers publish one per luminaire, usually on the product page next to the datasheet.
Inside, both formats are plain text. You will find:
- a header with the manufacturer, catalog number, luminaire and lamp description;
- the luminous flux (lumens), input power and the luminaire's physical dimensions;
- a grid of luminous intensity values in candela, measured at many vertical angles (gamma) for several horizontal planes (C-planes).
Plotting that grid gives the familiar polar diagram of the luminaire: how bright it is in each direction.
Why the usual tools do not help on a Mac
The best-known lighting design programs, DIALux and Relux, are built for Windows. They are the right tools if you need to calculate illuminance for a whole room or building, but they do not run natively on macOS. Mac users typically end up with one of the workarounds below.
Your options on a Mac
1. Run Windows
Install Windows in a virtual machine (Parallels Desktop, VMware Fusion, UTM) and run DIALux or Relux there. On Apple silicon Macs this means Windows for ARM, and x86 desktop software runs through emulation, which can be slow for heavy projects. Boot Camp only exists on Intel Macs. CrossOver or Wine may also work for some programs, with no guarantee for a given version.
- Good for: full lighting calculations and room simulations.
- Cost: a Windows licence, a virtualization product, disk space and setup time. A lot of machinery if you only want to see one diagram.
2. A web-based viewer
Several websites let you upload an IES or LDT file and show the distribution in the browser. They work on any computer and need no installation.
- Good for: a quick one-off look.
- Trade-offs: you need an internet connection, and you are uploading the file to someone else's server (some viewers process files locally in the browser, but you have to check each one). That matters if the data is under NDA or comes from a client project. Features such as comparing files or exporting reports vary a lot.
3. Open the file as text
Because the files are plain text, TextEdit or any code editor will open them. This is useful for checking the header (manufacturer, lumens, wattage) or for fixing a malformed line.
- Good for: reading metadata.
- Limitation: the candela grid is hundreds or thousands of numbers. You cannot judge a light distribution from that, and you will not see symmetry or beam angles without calculating them.
4. Other Mac apps and plugins
There are some options in specific ecosystems, for example plugins for 3D and CAD tools that import IES files for rendering. They are meant for applying the light to a scene, not for inspecting the data. Availability and macOS support change often, so check the current state of any tool before relying on it.
5. LumaScope
LumaScope is a native macOS app we make for exactly this job: open a photometric file and see what is in it. It is a viewer, not a lighting calculation tool. It will not replace DIALux or Relux for designing a lighting scheme.
What it does:
- opens
.iesand.ldtfiles, or whole folders of them, by drag and drop, File → Open or double-click in Finder; - draws a polar chart with the principal C-planes, and the same data as linear curves;
- shows the candela table and exports it to CSV;
- reads the header data (manufacturer, catalog number, lamp, flux, efficacy) and derives beam and field angles, zonal lumens and light output ratio;
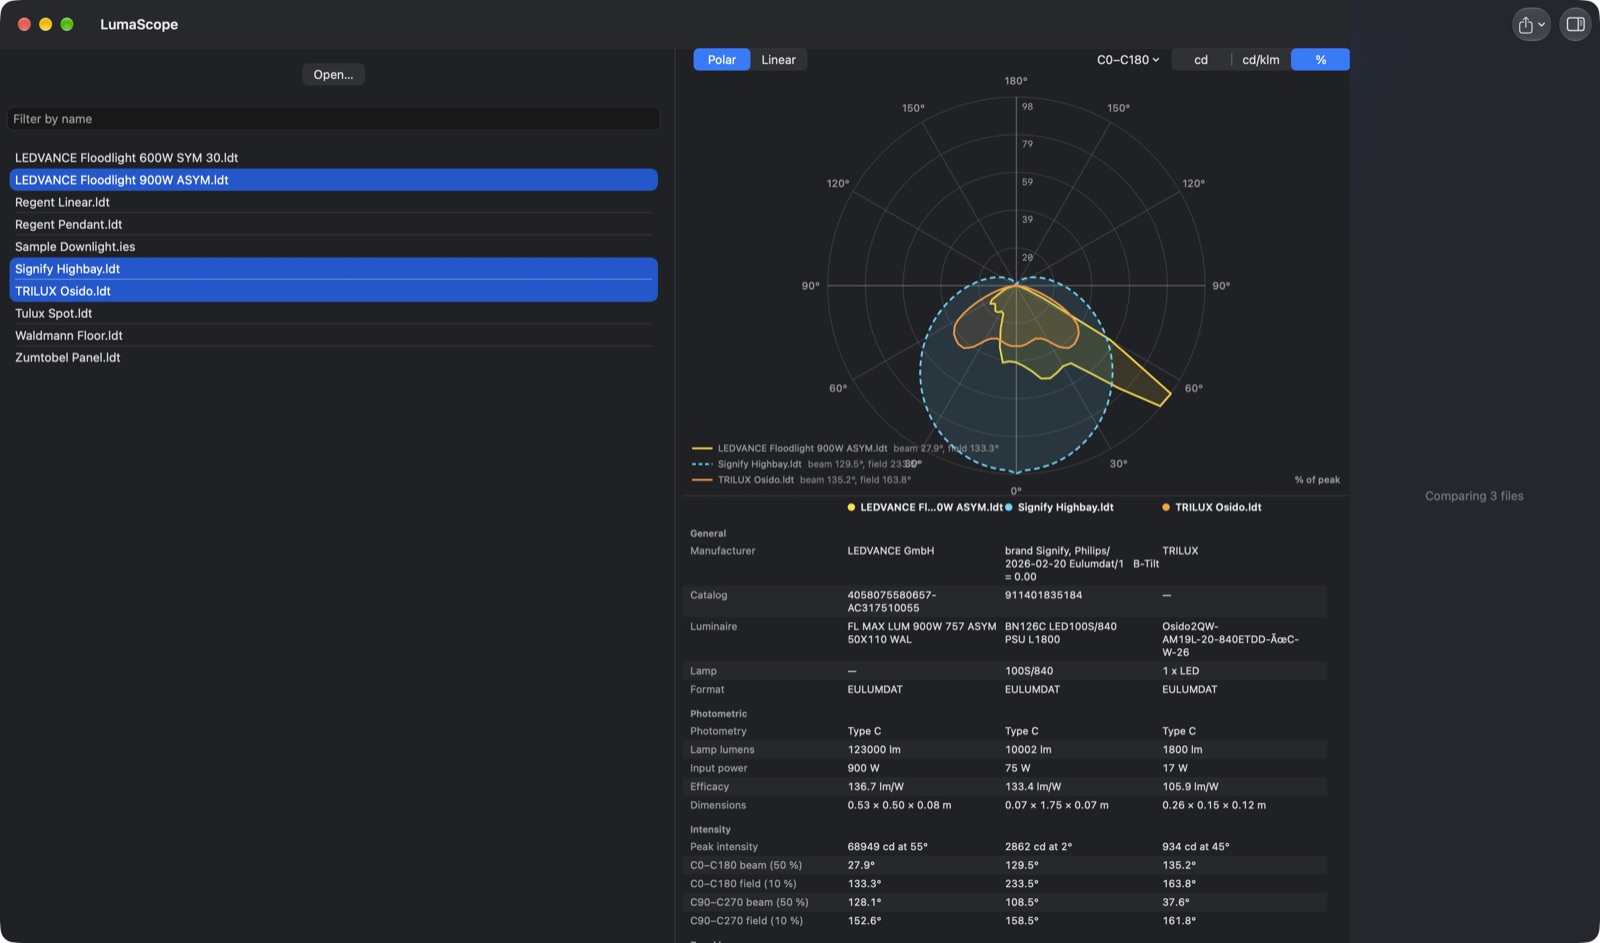
- compares several files by overlaying them, with their figures side by side;
- exports charts as PNG, PDF or SVG, and a one-page PDF report;
- shows a chart in Quick Look: select a file in Finder and press Space;
- opens files locally on your Mac, with no upload step. The interface is available in English, German, French, Spanish and Dutch.
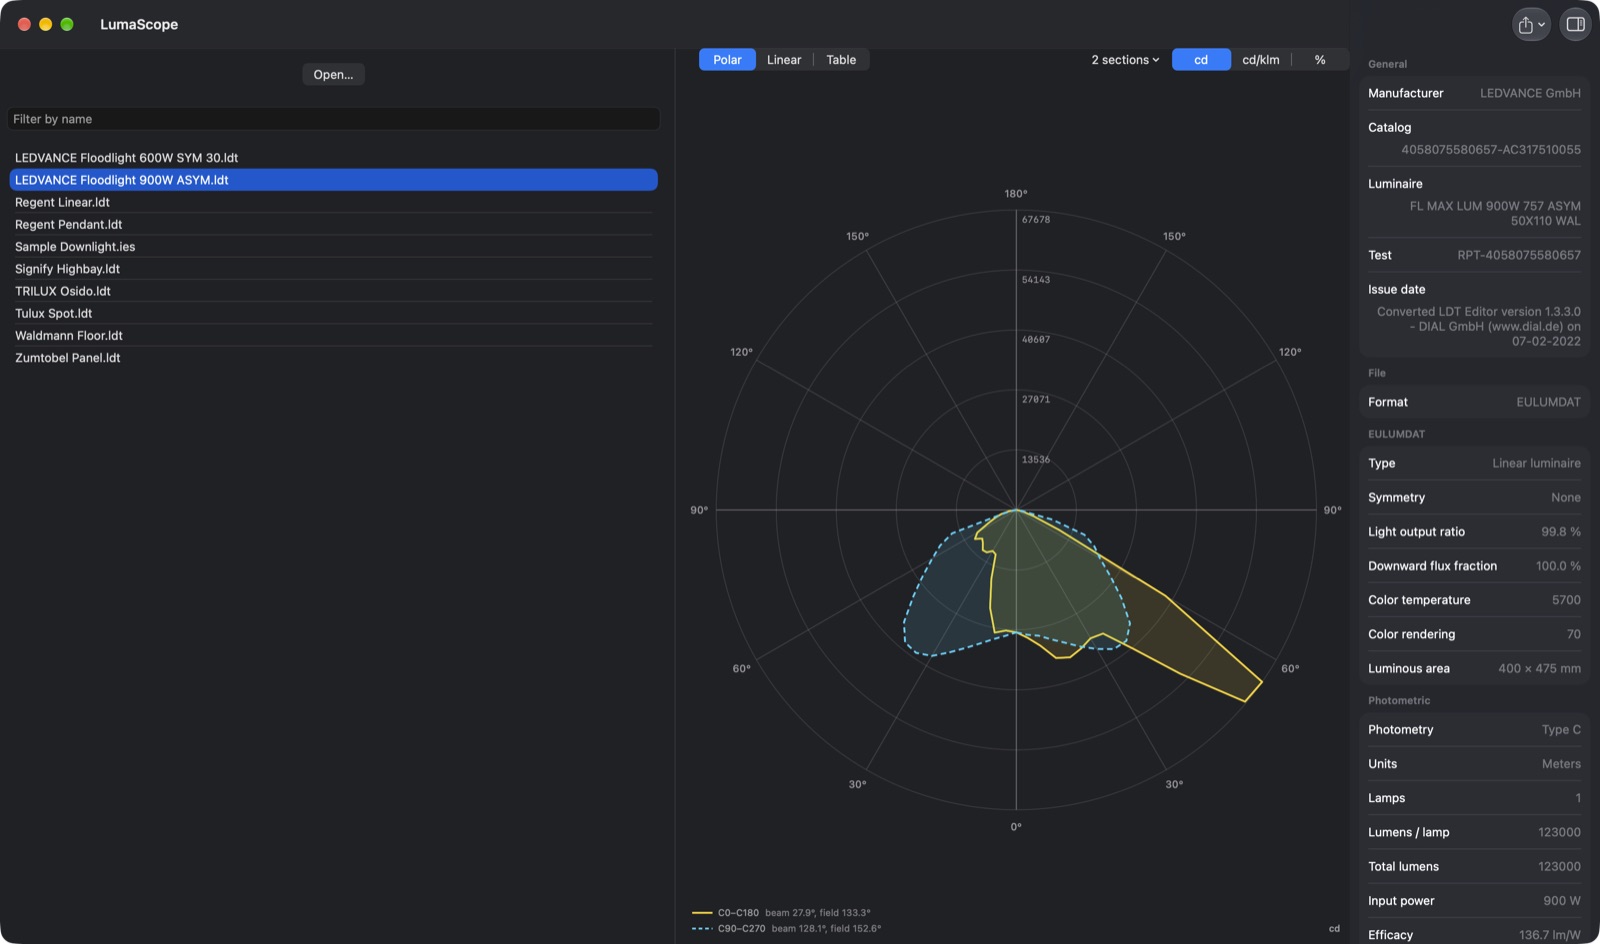
Comparing luminaires is often the real question: which of these three fixtures gives the narrowest beam at a similar output? Select the files in the sidebar and the charts are overlaid with a table of their metrics.
Requirements: macOS 14 (Sonoma) or later. It is sold on the Mac App Store for $9.99 in the US; prices vary by country.
Which option should you pick?
| You want to | Use |
|---|---|
| Calculate lighting for a room or building | A Windows VM with DIALux or Relux |
| Take a one-off look and do not mind uploading the file | A web viewer |
| Read the header or fix a text line | A text editor |
| Browse, compare and report on many files on your Mac, offline | LumaScope |
These are not mutually exclusive. Many Mac-based designers inspect and compare files in a viewer, then do the room calculation in a Windows tool.
Quick tip: checking a file before trusting it
Whatever you use, a few checks catch most problems:
- Compare the lumens and wattage in the file with the manufacturer's datasheet.
- Check that the shape of the diagram matches the product (a downlight should not look like a floodlight).
- If the file is
.ldt, make sure special characters in the header display correctly. Files exported on Windows are sometimes in an older text encoding.